Mastering dynamic SVG creating
We will do it by building radar chart from collection
I was recently challenged in one of my projects to build some radar charts dynamically from some data provided in a collection (we could say “table” but as we are in PowerApps environment we will be talking “collections” here) .
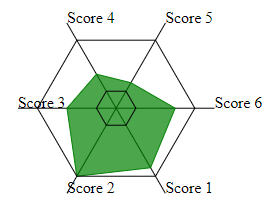
So we have a collection with 2 key values – score and title which we need convert into a pretty radar chart as on a picture on a right. I thought – peace of cake, just use one of the standard charts in PowerApps, but when I started looking in to it I realised that there is no radar chart in standard PA charts.
I know I could use Power BI, but for some reasons this project was to be PowerApps only. So I started googling and youtubing (apparently there is no such word as “youtubing” yet :/ , but I still gona use it 🙂 )
And thats what I came up with…
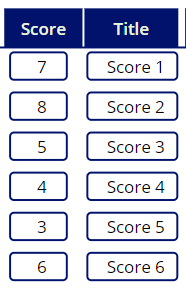
On a left are collection values we are going to build our chart from
I was lucky to still remember something from school geometry lessons so I knew we can find point coordinates if we know the angle and distance. So each record in the collection would be a separate beam (lines going outside from the centre in our cobweb), each equal length equal angle from previous beam) , and on this beam there will be a point with a distant from the centre dependant on the score.
And to find those coordinates we will be using some Sin and Cos functions
First we need to find how many rows/beams we have, and then find the angle between those beams

I find it easier to keep values, related to particular element, in one object, hence using Rc for that. I guess there is no need to explain what Count and Angle values are. Cntr – is a string of centre coordinates that will be used later. At the same time we create some blank collections for future use.
And now – lets start creating some coordinates (you may not believe me, but I loved geometry when I was in school )

Ok, so we have now a collection with coordinates for beams endings (centre coordinates string we created in the beginning)
Lets build some SVG code
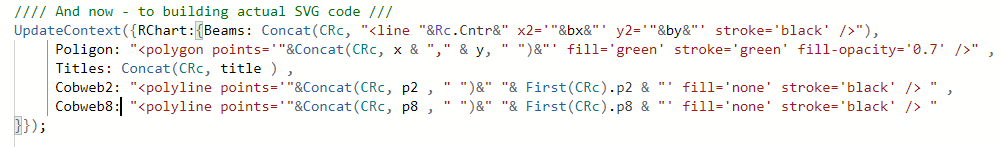
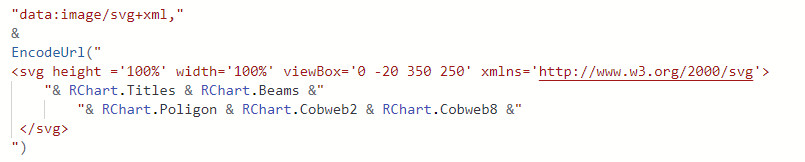
And the last thing – combine all those string into SVG image code, that goes under Image properties of the Image element
Thats it, job done! Took me only 7 hours in total to build it 🙂
Yes, you can add more cobwebs (per each 20% etc), add more texts, change lines thickness, colours